Search Results
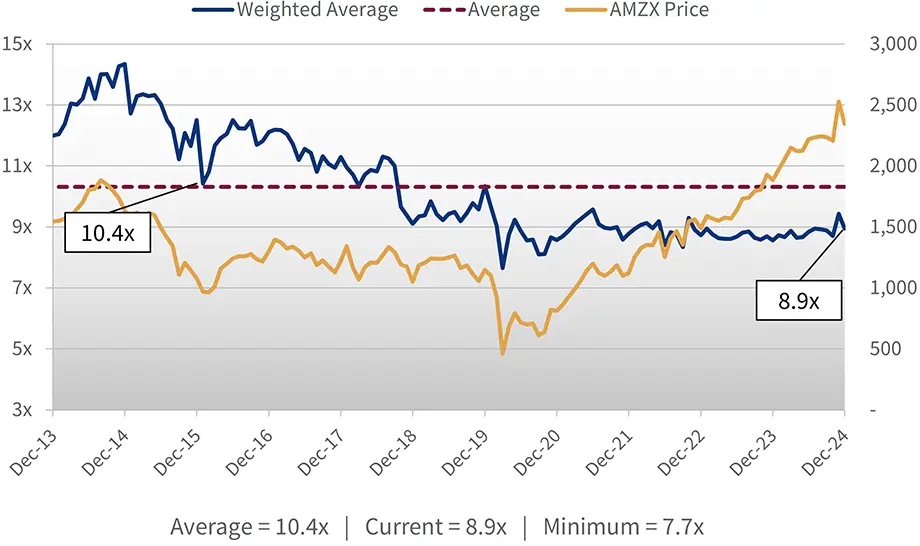
Source: Bloomberg LP, CCM, as of 12/31/24.
Chickasaw Capital Management, LLC gives no guarantees with respect to the success of its investment management services and has not authorized any person to represent or guarantee any particular investment results. Any historical data provided herein are solely for the purpose of illustrating past performance and not as a representation or prediction that such performance could or will be achieved in the future. Securities are subject to numerous risks, including market, currency, economic, political and business risks. Investments in securities will not always be profitable, and investors may lose money, including principal.
Chickasaw Capital Management, LLC does not provide legal, tax or accounting advice. Any statement contained in this communication concerning U.S. tax matters is not intended or written to be used, and cannot be used, for the purpose of avoiding penalties imposed on the relevant taxpayer. Clients of Chickasaw Capital Management, LLC should obtain their own independent tax advice based on their particular circumstances. Opinions expressed are current opinions as of the date appearing in this material only. No part of this material may be copied, photocopied or duplicated in any form, by any means, or redistributed without the prior written consent of Chickasaw Capital Management, LLC.
Certain information herein may be obtained from sources which we consider reliable, but we have not independently verified such information. We do not represent that such information is accurate or complete, and it should not be relied upon as such.
References to market or composite indices, benchmarks or other measures of relative market performance over a specified period of time (each, an “index”) are provided for your information only. Reference to this index does not imply that the portfolio will achieve returns, volatility or other results similar to the index. The composition of the index may not reflect the manner in which a portfolio is constructed in relation to expected or achieved returns, portfolio guidelines, restrictions, sectors, correlations, concentrations, volatility or tracking error targets, all of which are subject to change over time. Indices are unmanaged. The figures for the indices do not reflect the deduction of any fees or expenses which would reduce returns. Investors cannot invest directly in indices.
The Alerian MLP Index is a composite of the most prominent energy Master Limited Partnerships that provides investors with an unbiased, comprehensive benchmark for this emerging asset class. The index, which is calculated using a float-adjusted, capitalization-weighted methodology, is disseminated real-time on a price-return basis (NYSE: AMZ), and the corresponding total-return index is disseminated daily (NYSE: AMZX). Relevant data points such as dividend yield are also published daily. For index values, constituents, and announcements regarding constituent changes, please visit www.alerian.com.
“Alerian MLP Index”, “Alerian MLP Total Return Index”, “AMZ” and “AMZX” are servicemarks of GKD Index Partners, LLC d/b/a Alerian (“Alerian”) and their use is granted under a license from Alerian. Alerian does not guarantee the accuracy and/or completeness of the Alerian MLP Index or any data included therein and Alerian shall have no liability for any errors, omissions, interruptions or defects therein. Alerian makes no warranty, express or implied, representations or promises, as to results to be obtained by Licensee, or any other person or entity from the use of the Alerian MLP Index or any data included therein. Alerian makes no express or implied warranties, representations or promises, regarding the originality, merchantability, suitability, non-infringement, or fitness for a particular purpose or use with respect to the Alerian MLP Index or any data included therein. Without limiting any of the foregoing, in no event shall Alerian have any liability for any indirect, special, incidental, or consequential damages (including lost profits), arising out of the Alerian MLP Index or any data included therein, even if notified of the possibility of such damages.
The Energy MLP Classification Standard (“EMCS”) was developed by and is the exclusive property (and a service mark) of GKD Index Partners, LLC d/b/a Alerian (“Alerian”) and its use is granted under a license from Alerian. Alerian make no warranties, express or implied, or representations with respect to such standard or classification (or the results to be obtained by the use thereof), and hereby expressly disclaims all warranties of originality, accuracy, completeness, merchantability, suitability, non-infringement, or fitness for a particular purpose with respect to any such standard or classification. No warranty is given that the standard or classification will conform to any description thereof or be free of omissions, errors, interruptions, or defects. Without limiting any of the foregoing, in no event shall Alerian have any liability for any indirect, special, incidental, or consequential damages (including lost profits), arising out of any such standard or classification, even if notified of the possibility of such damages.
EBITDA is earnings before interest, taxes, depreciation and amortization.
EV/EBITDA is a ratio used to determine the value of a company. The enterprise multiple looks at a firm as a potential acquirer would, because it takes debt into account – an item which other multiples like the P/E ratio do not include. Enterprise multiple is calculated as: Enterprise multiple = EV/EBITDA.
This material is provided for informational and educational purposes only and should not be construed as investment advice or an offer or solicitation to buy or sell any security, product or service.
PAST PERFORMANCE DOES NOT GUARANTEE FUTURE RESULTS
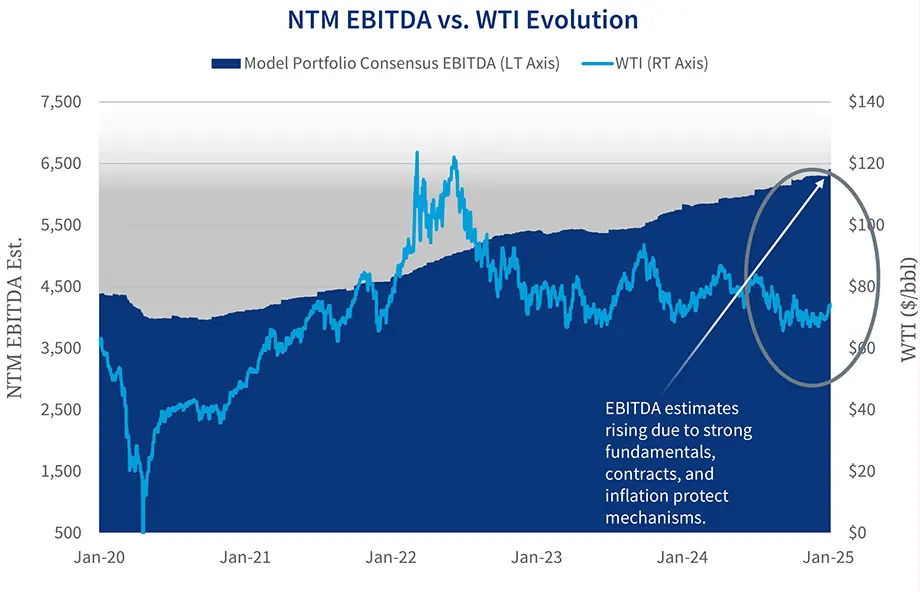
Source: Bloomberg, LP at 12/31/24.
All figures shown for current model portfolio weights and holdings. EBITDA is the consensus estimate at each point in time for the weighted sum of each portfolio holding for the next twelve months (NTM). This is not a forecast of the portfolio’s future performance. EBITDA growth does not guarantee a corresponding increase in the market value of the holding or the portfolio.
Chickasaw Capital Management, LLC gives no guarantees with respect to the success of its investment management services and has not authorized any person to represent or guarantee any particular investment results. Any historical data provided herein are solely for the purpose of illustrating past performance and not as a representation or prediction that such performance could or will be achieved in the future. Securities are subject to numerous risks, including market, currency, economic, political and business risks. Investments in securities will not always be profitable, and investors may lose money, including principal.
Chickasaw Capital Management, LLC does not provide legal, tax or accounting advice. Any statement contained in this communication concerning U.S. tax matters is not intended or written to be used, and cannot be used, for the purpose of avoiding penalties imposed on the relevant taxpayer. Clients of Chickasaw Capital Management, LLC should obtain their own independent tax advice based on their particular circumstances. Opinions expressed are current opinions as of the date appearing in this material only. No part of this material may be copied, photocopied or duplicated in any form, by any means, or redistributed without the prior written consent of Chickasaw Capital Management, LLC.
Certain information herein may be obtained from sources which we consider reliable, but we have not independently verified such information. We do not represent that such information is accurate or complete, and it should not be relied upon as such.
Cash Flow is a revenue or expense stream that changes a cash account over a given period. Cash inflows usually arise from one of three activities – financing, operations or investing – although this also occurs as a result of donations or gifts in the case of personal finance. Cash outflows result from expenses or investments. This holds true for both business and personal finance. Cash flow can be attributed to a specific project, or to a business as a whole. Cash flow can be used as an indication of a company’s financial strength.
EBITDA is earnings before interest, taxes, depreciation and amortization.
West Texas Intermediate (WTI), also known as Texas light sweet, is a grade of crude oil used as a benchmark in oil pricing. This grade is described as light because of its relatively low density, and sweet because of its low sulfur content. It is the underlying commodity of Chicago Mercantile Exchange’s oil futures contracts.
Information contains current holdings DTM, which IPO’d on 9/13/21 and KNTK which was reorganized in November 10, 2020. Information up through both dates, respectively, is adjusted to exclude the current weighting in DTM & KNTK. Impact to results is de minimis.
This material is provided for informational and educational purposes only and should not be construed as investment advice or an offer or solicitation to buy or sell any security, product or service.
PAST PERFORMANCE DOES NOT GUARANTEE FUTURE RESULTS
Solid historical performance
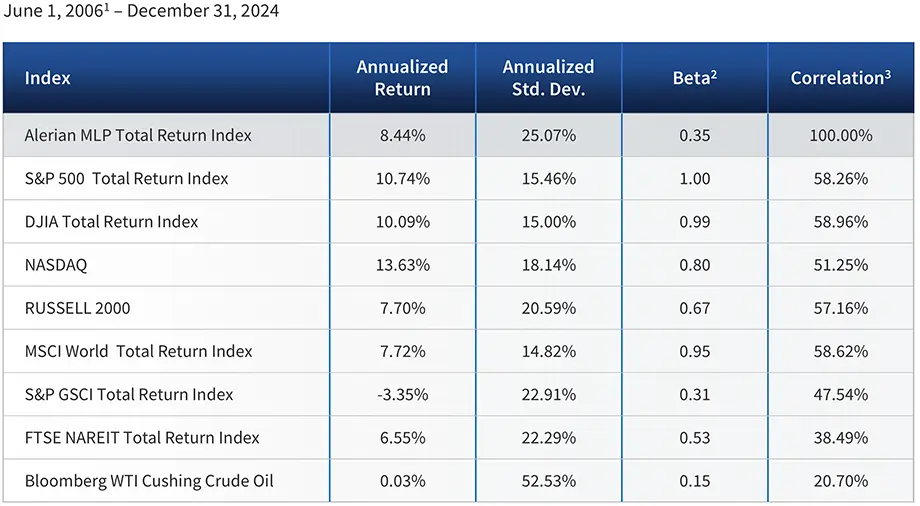
(1) Launch date of the Alerian MLP Total Return Index. (2) Relative to the S&P 500 Total Return Index calculated over the whole period (monthly data) based on excess return over 30 days T-Bills. (3) Relative to the Alerian MLP Total Return Index.
Chickasaw Capital Management, LLC gives no guarantees with respect to the success of its investment management services and has not authorized any person to represent or guarantee any particular investment results. Any historical data provided herein are solely for the purpose of illustrating past performance and not as a representation or prediction that such performance could or will be achieved in the future. Securities are subject to numerous risks, including market, currency, economic, political and business risks. Investments in securities will not always be profitable, and investors may lose money, including principal.
Chickasaw Capital Management, LLC does not provide legal, tax or accounting advice. Any statement contained in this communication concerning U.S. tax matters is not intended or written to be used, and cannot be used, for the purpose of avoiding penalties imposed on the relevant taxpayer. Clients of Chickasaw Capital Management, LLC should obtain their own independent tax advice based on their particular circumstances. Opinions expressed are current opinions as of the date appearing in this material only. No part of this material may be copied, photocopied or duplicated in any form, by any means, or redistributed without the prior written consent of Chickasaw Capital Management, LLC.
Certain information herein may be obtained from sources which we consider reliable, but we have not independently verified such information. We do not represent that such information is accurate or complete, and it should not be relied upon as such.
References to market or composite indices, benchmarks or other measures of relative market performance over a specified period of time (each, an “index”) are provided for your information only. Reference to this index does not imply that the portfolio will achieve returns, volatility or other results similar to the index. The composition of the index may not reflect the manner in which a portfolio is constructed in relation to expected or achieved returns, portfolio guidelines, restrictions, sectors, correlations, concentrations, volatility or tracking error targets, all of which are subject to change over time. Indices are unmanaged. The figures for the indices do not reflect the deduction of any fees or expenses which would reduce returns. Investors cannot invest directly in indices.
The Alerian MLP Index is a composite of the most prominent energy Master Limited Partnerships that provides investors with an unbiased, comprehensive benchmark for this emerging asset class. The index, which is calculated using a float-adjusted, capitalization-weighted methodology, is disseminated real-time on a price-return basis (NYSE: AMZ), and the corresponding total-return index is disseminated daily (NYSE: AMZX). Relevant data points such as dividend yield are also published daily. For index values, constituents, and announcements regarding constituent changes, please visit www.alerian.com.
“Alerian MLP Index”, “Alerian MLP Total Return Index”, “AMZ” and “AMZX” are servicemarks of GKD Index Partners, LLC d/b/a Alerian (“Alerian”) and their use is granted under a license from Alerian. Alerian does not guarantee the accuracy and/or completeness of the Alerian MLP Index or any data included therein and Alerian shall have no liability for any errors, omissions, interruptions or defects therein. Alerian makes no warranty, express or implied, representations or promises, as to results to be obtained by Licensee, or any other person or entity from the use of the Alerian MLP Index or any data included therein. Alerian makes no express or implied warranties, representations or promises, regarding the originality, merchantability, suitability, non-infringement, or fitness for a particular purpose or use with respect to the Alerian MLP Index or any data included therein. Without limiting any of the foregoing, in no event shall Alerian have any liability for any indirect, special, incidental, or consequential damages (including lost profits), arising out of the Alerian MLP Index or any data included therein, even if notified of the possibility of such damages.
The Energy MLP Classification Standard (“EMCS”) was developed by and is the exclusive property (and a service mark) of GKD Index Partners, LLC d/b/a Alerian (“Alerian”) and its use is granted under a license from Alerian. Alerian make no warranties, express or implied, or representations with respect to such standard or classification (or the results to be obtained by the use thereof), and hereby expressly disclaims all warranties of originality, accuracy, completeness, merchantability, suitability, non-infringement, or fitness for a particular purpose with respect to any such standard or classification. No warranty is given that the standard or classification will conform to any description thereof or be free of omissions, errors, interruptions, or defects. Without limiting any of the foregoing, in no event shall Alerian have any liability for any indirect, special, incidental, or consequential damages (including lost profits), arising out of any such standard or classification, even if notified of the possibility of such damages.
Bloomberg WTI Cushing Crude Oil: West Texas Intermediate (WTI), also known as Texas light sweet, is a grade of crude oil used as a benchmark in oil pricing. This grade is described as light because of its relatively low density, and sweet because of its low sulfur content. It is the underlying commodity of Chicago Mercantile Exchange’s oil futures contracts.
DJIA Total Return Index: Tracks the total return of The Dow Jones Industrial Average, a price-weighted average of 30 significant stocks traded on the New York Stock Exchange and the Nasdaq. Dividends are reinvested. The DJIA was invented by Charles Dow back in 1896.
FTSE NAREIT US Real Estate Total Return Index Series: Tracks the total return of the FTSE NAREIT US Real Estate Index Series which is designed to present investors with a comprehensive family of REIT performance indexes that spans the commercial real estate space across the US economy. Dividends are reinvested. The index series provides investors with exposure to all investment and property sectors. In addition, the more narrowly focused property sector and sub-sector indexes provide the facility to concentrate commercial real estate exposure in more selected markets.
MSCI World Total Return Index: Tracks the total return of the MSCI World Index, a market capitalization weighted index designed by Morgan Stanley Capital International to track the overall performance of commodity producers throughout the world. Dividends are reinvested. Stocks in the MSCI All Country World Commodity Producers Sector Capped Index are primarily focused on emerging market economies.
NASDAQ: A market-capitalization weighted index of the more than 3,000 common equities listed on the Nasdaq stock exchange. The types of securities in the index include American depositary receipts, common stocks, real estate investment trusts (REITs) and tracking stocks. The index includes all Nasdaq listed stocks that are not derivatives, preferred shares, funds, exchange-traded funds (ETFs) or debentures.
Russell 2000: An index measuring the performance approximately 2,000 small-cap companies in the Russell 3000 Index, which is made up of 3,000 of the biggest U.S. stocks. The Russell 2000 serves as a benchmark for small-cap stocks in the United States.
S&P 500 Total Return Index: Tracks the total return of the S&P 500 Index, an index of 500 stocks chosen for market size, liquidity and industry grouping, among other factors. Dividends are reinvested. The S&P 500 is designed to be a leading indicator of U.S. equities and is meant to reflect the risk/return characteristics of the large cap universe.
S&P GSCI Total Return Index: Tracks the total return of the S&P GSCI, a composite index of commodity sector returns representing an unleveraged, long-only investment in commodity futures that is broadly diversified across the spectrum of commodities. Dividends are reinvested. The returns are calculated on a fully collateralized basis with full reinvestment.
One cannot directly invest in an index.
Annualized Standard Deviation measures the dispersion or uncertainty in a random variable, such as an investment return. It measures the degree of variation of the random variable around the mean. The higher the volatility of the random variable, the higher the standard deviation will be. For this reason, standard deviation is often used as a measure of investment risk. Annualized Standard Deviation is equal to monthly standard deviation multiplied by the square root of 12.
Beta is the slope of the regression line. Beta measures the investment relative to the market. It describes the sensitivity of the investment to market movements. The market can be any index or investment specified.
Correlation measures the extent of linear association of two variables.
This material is provided for informational and educational purposes only and should not be construed as investment advice or an offer or solicitation to buy or sell any security, product or service.
PAST PERFORMANCE DOES NOT GUARANTEE FUTURE RESULTS
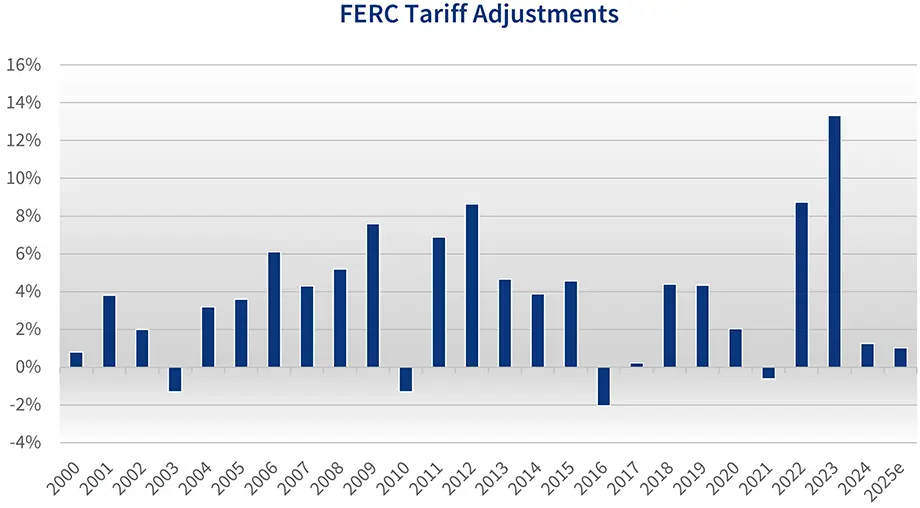
History of outperforming other investments during high inflationary periods
Chickasaw Capital Management, LLC gives no guarantees with respect to the success of its investment management services and has not authorized any person to represent or guarantee any particular investment results. Any historical data provided herein are solely for the purpose of illustrating past performance and not as a representation or prediction that such performance could or will be achieved in the future. Securities are subject to numerous risks, including market, currency, economic, political and business risks. Investments in securities will not always be profitable, and investors may lose money, including principal.
Chickasaw Capital Management, LLC does not provide legal, tax or accounting advice. Any statement contained in this communication concerning U.S. tax matters is not intended or written to be used, and cannot be used, for the purpose of avoiding penalties imposed on the relevant taxpayer. Clients of Chickasaw Capital Management, LLC should obtain their own independent tax advice based on their particular circumstances. Opinions expressed are current opinions as of the date appearing in this material only. No part of this material may be copied, photocopied or duplicated in any form, by any means, or redistributed without the prior written consent of Chickasaw Capital Management, LLC.
Certain information herein may be obtained from sources which we consider reliable, but we have not independently verified such information. We do not represent that such information is accurate or complete, and it should not be relied upon as such.
CPI (Consumer Price Index) is a measure of prices paid by consumers for a market basket of consumer goods and services. The yearly (or monthly) growth rates represent the inflation rate.
FERC is the U.S. Federal Energy Regulatory Commission.
PPI (Producer Price Index) is a measure of the change in the price of goods as they leave their place of production.
This material is provided for informational and educational purposes only and should not be construed as investment advice or an offer or solicitation to buy or sell any security, product or service.
PAST PERFORMANCE DOES NOT GUARANTEE FUTURE RESULTS
Distributions may be tax-deferred or subject to other preferential tax treatment

Chickasaw Capital Management, LLC gives no guarantees with respect to the success of its investment management services and has not authorized any person to represent or guarantee any particular investment results. Any historical data provided herein are solely for the purpose of illustrating past performance and not as a representation or prediction that such performance could or will be achieved in the future. Securities are subject to numerous risks, including market, currency, economic, political and business risks. Investments in securities will not always be profitable, and investors may lose money, including principal.
Chickasaw Capital Management, LLC does not provide legal, tax or accounting advice. Any statement contained in this communication concerning U.S. tax matters is not intended or written to be used, and cannot be used, for the purpose of avoiding penalties imposed on the relevant taxpayer. Clients of Chickasaw Capital Management, LLC should obtain their own independent tax advice based on their particular circumstances. Opinions expressed are current opinions as of the date appearing in this material only. No part of this material may be copied, photocopied or duplicated in any form, by any means, or redistributed without the prior written consent of Chickasaw Capital Management, LLC.
Certain information herein may be obtained from sources which we consider reliable, but we have not independently verified such information. We do not represent that such information is accurate or complete, and it should not be relied upon as such.
This material is provided for informational and educational purposes only and should not be construed as investment advice or an offer or solicitation to buy or sell any security, product or service.
PAST PERFORMANCE DOES NOT GUARANTEE FUTURE RESULTS
Flexibility to play a role in several portfolio allocation categories
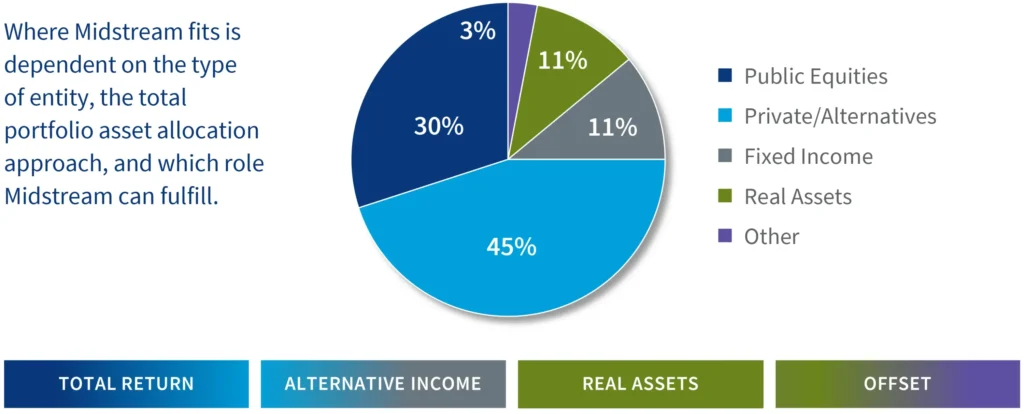
Note: Figures may not equal 100% due to rounding.
Source: NACUBO, “2023 NACUBO-Commonfund Study of Endowments”, 2/15/24.
Chickasaw Capital Management, LLC gives no guarantees with respect to the success of its investment management services and has not authorized any person to represent or guarantee any particular investment results. Any historical data provided herein are solely for the purpose of illustrating past performance and not as a representation or prediction that such performance could or will be achieved in the future. Securities are subject to numerous risks, including market, currency, economic, political and business risks. Investments in securities will not always be profitable, and investors may lose money, including principal.
Chickasaw Capital Management, LLC does not provide legal, tax or accounting advice. Any statement contained in this communication concerning U.S. tax matters is not intended or written to be used, and cannot be used, for the purpose of avoiding penalties imposed on the relevant taxpayer. Clients of Chickasaw Capital Management, LLC should obtain their own independent tax advice based on their particular circumstances. Opinions expressed are current opinions as of the date appearing in this material only. No part of this material may be copied, photocopied or duplicated in any form, by any means, or redistributed without the prior written consent of Chickasaw Capital Management, LLC.
Certain information herein may be obtained from sources which we consider reliable, but we have not independently verified such information. We do not represent that such information is accurate or complete, and it should not be relied upon as such.
Cash Flow is a revenue or expense stream that changes a cash account over a given period. Cash inflows usually arise from one of three activities – financing, operations or investing – although this also occurs as a result of donations or gifts in the case of personal finance. Cash outflows result from expenses or investments. This holds true for both business and personal finance. Cash flow can be attributed to a specific project, or to a business as a whole. Cash flow can be used as an indication of a company’s financial strength.
Distributions are quarterly dividend payments made to Limited Partner (LP) and General Partner (GP) investors. These amounts are set by the GP and are supported by an MLP’s operating cash flows.
Distribution Coverage Ratio is calculated as cash available to limited partners divided by cash distributed to limited partners. It gives an indication of an MLP’s ability to make dividend payments to limited partner investors from operating cash flows. MLPs with a coverage ratio of in excess of 1.0 times are able to meet their dividend payments without external financing.
Yield refers to the cash dividend or distribution divided by the share or unit price at a particular point in time.
This material is provided for informational and educational purposes only and should not be construed as investment advice or an offer or solicitation to buy or sell any security, product or service.
PAST PERFORMANCE DOES NOT GUARANTEE FUTURE RESULTS
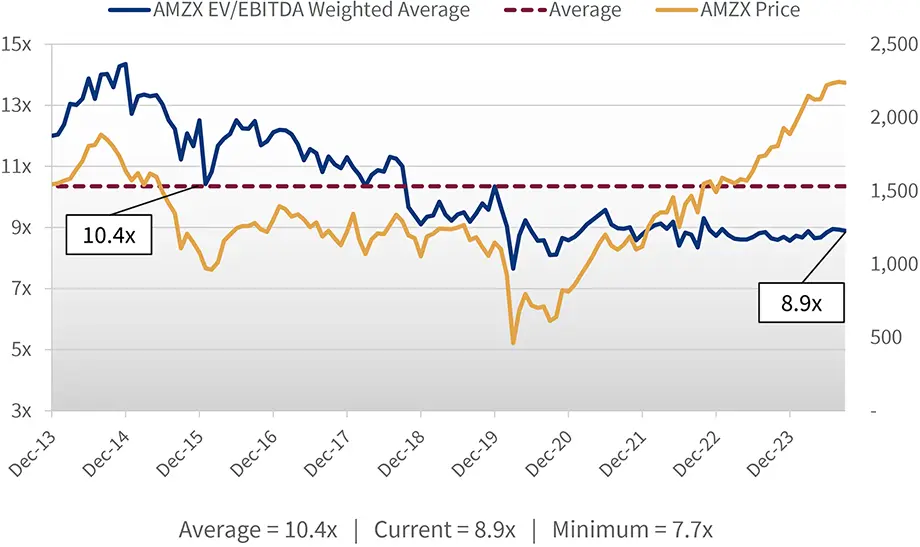
Source: Bloomberg LP, CCM, as of 9/30/24.
Chickasaw Capital Management, LLC gives no guarantees with respect to the success of its investment management services and has not authorized any person to represent or guarantee any particular investment results. Any historical data provided herein are solely for the purpose of illustrating past performance and not as a representation or prediction that such performance could or will be achieved in the future. Securities are subject to numerous risks, including market, currency, economic, political and business risks. Investments in securities will not always be profitable, and investors may lose money, including principal.
Chickasaw Capital Management, LLC does not provide legal, tax or accounting advice. Any statement contained in this communication concerning U.S. tax matters is not intended or written to be used, and cannot be used, for the purpose of avoiding penalties imposed on the relevant taxpayer. Clients of Chickasaw Capital Management, LLC should obtain their own independent tax advice based on their particular circumstances. Opinions expressed are current opinions as of the date appearing in this material only. No part of this material may be copied, photocopied or duplicated in any form, by any means, or redistributed without the prior written consent of Chickasaw Capital Management, LLC.
Certain information herein may be obtained from sources which we consider reliable, but we have not independently verified such information. We do not represent that such information is accurate or complete, and it should not be relied upon as such.
References to market or composite indices, benchmarks or other measures of relative market performance over a specified period of time (each, an “index”) are provided for your information only. Reference to this index does not imply that the portfolio will achieve returns, volatility or other results similar to the index. The composition of the index may not reflect the manner in which a portfolio is constructed in relation to expected or achieved returns, portfolio guidelines, restrictions, sectors, correlations, concentrations, volatility or tracking error targets, all of which are subject to change over time. Indices are unmanaged. The figures for the indices do not reflect the deduction of any fees or expenses which would reduce returns. Investors cannot invest directly in indices.
The Alerian MLP Index is a composite of the most prominent energy Master Limited Partnerships that provides investors with an unbiased, comprehensive benchmark for this emerging asset class. The index, which is calculated using a float-adjusted, capitalization-weighted methodology, is disseminated real-time on a price-return basis (NYSE: AMZ), and the corresponding total-return index is disseminated daily (NYSE: AMZX). Relevant data points such as dividend yield are also published daily. For index values, constituents, and announcements regarding constituent changes, please visit www.alerian.com.
“Alerian MLP Index”, “Alerian MLP Total Return Index”, “AMZ” and “AMZX” are servicemarks of GKD Index Partners, LLC d/b/a Alerian (“Alerian”) and their use is granted under a license from Alerian. Alerian does not guarantee the accuracy and/or completeness of the Alerian MLP Index or any data included therein and Alerian shall have no liability for any errors, omissions, interruptions or defects therein. Alerian makes no warranty, express or implied, representations or promises, as to results to be obtained by Licensee, or any other person or entity from the use of the Alerian MLP Index or any data included therein. Alerian makes no express or implied warranties, representations or promises, regarding the originality, merchantability, suitability, non-infringement, or fitness for a particular purpose or use with respect to the Alerian MLP Index or any data included therein. Without limiting any of the foregoing, in no event shall Alerian have any liability for any indirect, special, incidental, or consequential damages (including lost profits), arising out of the Alerian MLP Index or any data included therein, even if notified of the possibility of such damages.
The Energy MLP Classification Standard (“EMCS”) was developed by and is the exclusive property (and a service mark) of GKD Index Partners, LLC d/b/a Alerian (“Alerian”) and its use is granted under a license from Alerian. Alerian make no warranties, express or implied, or representations with respect to such standard or classification (or the results to be obtained by the use thereof), and hereby expressly disclaims all warranties of originality, accuracy, completeness, merchantability, suitability, non-infringement, or fitness for a particular purpose with respect to any such standard or classification. No warranty is given that the standard or classification will conform to any description thereof or be free of omissions, errors, interruptions, or defects. Without limiting any of the foregoing, in no event shall Alerian have any liability for any indirect, special, incidental, or consequential damages (including lost profits), arising out of any such standard or classification, even if notified of the possibility of such damages.
EBITDA is earnings before interest, taxes, depreciation and amortization.
EV/EBITDA is a ratio used to determine the value of a company. The enterprise multiple looks at a firm as a potential acquirer would, because it takes debt into account – an item which other multiples like the P/E ratio do not include. Enterprise multiple is calculated as: Enterprise multiple = EV/EBITDA.
This material is provided for informational and educational purposes only and should not be construed as investment advice or an offer or solicitation to buy or sell any security, product or service.
PAST PERFORMANCE DOES NOT GUARANTEE FUTURE RESULTS